Data Deep-Dive
May 26 (Replay at end of page)
For the third session of our donor research summit, we took a closer look at the data we collected in our survey of over 5,000 arts organization donors earlier this year. There were so many interesting results we found from this study — more than could fit into our main story around the Community Donor.
This meeting was an opportunity for us to dive more deeply into these additional findings with ABA’s Executive Director of Research, Karen Freeman, and Research Lead, Shelley West.

Survey Methodology and Participants
To start everyone off on the same page, we walked through the research process for the study — specifically, the structure and methodology of our donor survey. The target list for our survey was individual donors who gave at least $250 once over the past three years. We had 47 organizations provide us with these donor lists, and a majority removed their biggest donors (such as board members).
Our questions were divided into four types:
Donations to the arts organization: these questions asked respondents to describe their relationship with the arts institution, specifically as a donor. These included how often they visited the institution, how much and how often they had donated, why they donated, and any obstacles they faced to giving.
Impact of benefits to giving: this section was to give us an understanding of benefits’ effects on donor behavior, with questions around what benefits they received, which ones were important to them, and what they would do if those benefits were removed.
Overall charitable giving: next, we asked donors about their giving outside of the arts organization, posing many of the same questions so we could compare and contrast. This section also allowed us to understand how donors prioritized the arts organization among their full giving portfolio, as well as their future giving plans.
Personal values & demographics: the final portion of questions were used to establish some additional information about the donors themselves: their values, demographics, employment status and more.
For the analysis, we first clustered all the questions to show where different questions actually reflected the same concept. We then conducted a cluster analysis, “forcing” donors into different segments mathematically. Finally, we ran a regression analysis. This showed us which elements drive higher donation levels at different tiers of donation.
Next, we took a look at the demographics of the survey participants themselves.
Our survey responses came in at a fairly even split between opera, theater, ballet, and orchestra institutions. We also had representation with a slightly smaller sample size for presenters, festivals, museums, choruses, and schools. Geographically, our United States-based donors were sizable, at 84% — not a surprise given our membership. We were, however, grateful to our members and friends in Canada, Ireland, and the United Kingdom, whose donors made up the remaining 16% of responses.
Below are the four major categories of demographics we asked: age, gender, employment and race/ethnicity.

Here, the survey sample does reflect, for the most part, the often homogeneous state of our audiences and donors.
Profile of the Three Donor Segments
Cluster analysis helps us find patterns across all the responses — and then we can see if there are underlying threads across answers that cluster together. In our analysis, we found that donors clustered into three segments:
Benefits Donors: these individuals are motivated by accessing benefits, accessing the network of other donors, and the potential tax write-off of giving.
Arts Lovers: these are people who are motivated primarily by the love of the art and by the desire to support the cultural vibrancy of their area.
Community Donors: the motivation of these donors is twofold: one is that they support projects and community activities — these are the people who want to have impact on the community where they live. The other is that they support friends and family and access the network of donors — they want to be part of a community.
The cluster analysis gave each of the three segments a score on each question on motivation to give. The color coding in the graph below tells you a bit about the ‘intensity’ of a given motivation in defining a segment. Green is the highest intensity, down to red at the lowest.

There were a few interesting points to highlight from this expanded data:
Benefits donors are dramatically defined by their desire to access benefits.
Arts lovers are far less motivated by benefits and supporting their friends and family than the average donor.
Community and benefits donors are not differentiated by their motivation to support the organization for which they took the survey (as opposed to arts lovers, who do form a strong emotional connection to the institution).
Going deeper into the segments, we saw how they distribute across genres and regions, particularly in terms of the numbers of donors and amounts given.
The segments saw more or less the same split (roughly one-third of donors in each motivational cluster) across genres, with a few exceptions. Ballet respondents had as many community donors as arts lovers. Orchestras had many more arts lovers. Presenters had more benefits-driven donors. And finally, our museums had many more community donors.
We also saw how donation amounts translated across the segments in various genres, shown in the graphs below with notable exceptions highlighted:

Next, we took a look at geographical differences. Our US and Canadian segments mirrored the average distribution of motivations fairly closely, with a slight evening out of the benefits and arts donors in Canada. In the UK and Ireland, however, 45% of donors are actually community donors.
In terms of donation amounts, it is true that, on average, the benefits donors give the most in the UK and Ireland. Yet, it is still true that community donors are the most generous of the philanthropic donors (meaning those who do not give primarily to access benefits), across regions.
Highlights: Why and How Donors Give
The final part of our session was an overview of some of the most interesting findings from our survey on a variety of topics. We discussed this data in four main segments.
Donation Strategy and Confidence
Our first major finding, which was consistent both across survey answers and in the in-depth interviews we conducted with donors to arts organizations, is that donors rely on their “gut” feelings and their routines — that is, they plan very little and fall quickly into hard-to-break giving habits. This consistency means that once you are on a donor’s list, you tend to stay there — but for the same reason, it can be hard to get there in the first place.

Yet, despite their low amount of planning, donors are overwhelmingly consistent in their confidence that they give the right amount to the organizations in their donation portfolios. A combined 72% of arts donors were very confident or confident in their donation to the arts organization. Donors were a little less certain about their donations to other causes and nonprofits overall, but still generally quite sure they were doing the right thing.
One opportunity in this area: less than half of participants believe their donations are enough, and over a third believe they could give more. This suggests there is some opportunity to tap into these sentiments and grow these donors.
Connection to the arts organization
Next we looked at donors’ involvement with activities at their arts organizations — which, unsurprisingly, was very high. We ran another cluster analysis to segment these activities into four types of donor engagement:
Connection with your staff
Giving time via volunteering or serving on a board or committee
Participation in events (both digital and live)
Attendance and subscription — those donors who really just come for the art
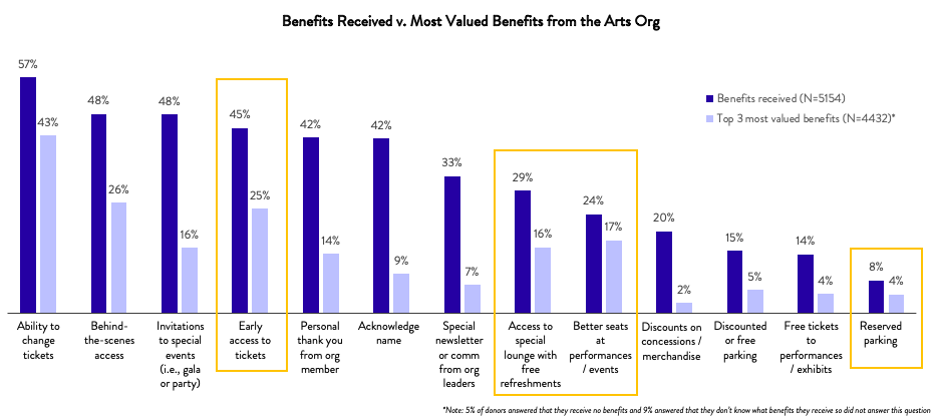
Next, we looked at the donors’ thoughts on benefits, and found that there were several areas of opportunity. Often the benefits that more donors received were, logically, the ones most donors indicated as important. However, the benefits in yellow show several benefits that are really highly valued compared to how often they are offered.
We were also heartened to see that donors, for the most part, would continue giving without benefits — a very relevant data point during the pandemic. When asked what they would do if the organization modified or eliminated the benefits they value most, 72% said their donation would not change vs. 27% who said they would decrease (but most of them only somewhat). Furthermore, when the idea of another year of no benefits specifically due to the pandemic was raised to all donors, 76% said they would not change their donation levels — and 12% even said they would increase.
Drivers of donation change
When asked about their future plans to donate, just 7% of respondents said that they would decrease. We know a lot of organizations are worried about donors being “tapped out” after an extraordinarily generous year, but fortunately it looks like the risk is low.
We asked those who plan to increase their giving to explain why, and five salient reasons for increase popped out of a list of thirteen choices:
Donor Capacity: the donor expects income to increase or plans to increase giving overall
Organization Campaign: the institution starting a campaign of interest to the donor
Organizational Need: the institution has a greater need for donations
Organizational Vision: the donor is encouraged by the direction of the institution or is excited by programming
Was Asked: the organization or someone close to them asked the donor to give more
The list was the same for what has already made donors increase giving to an organization in the past, with one notable exception: organizational need was not a strong motivator for past increases in giving.
Donors’ direct answers were not the only way we could determine factors that lead to donating more. We ran analysis to see if other elements had correlations with higher giving, and found two interesting results. First, donors were notably more likely to agree that they had a personal relationship with organizations where they had increased their donation. They were also more likely to have gotten to know the staff. This reinforces our previous findings about the importance of donor officers and personal connection to drive donation increases.
Additionally, values play an important role in increasing giving. In the graph below, we can see a great opportunity based on the noteworthy bump in agreement among increasers that the organization they boosted their gifts to shares the values that are particularly important to them:

We will be speaking much more about shared values during our final session of the summit, and how to leverage them in your fundraising efforts.
Diversity, equity, inclusion, and accessibility
Finally, we looked at donors’ thoughts on arts organizations’ work in DEI&A.
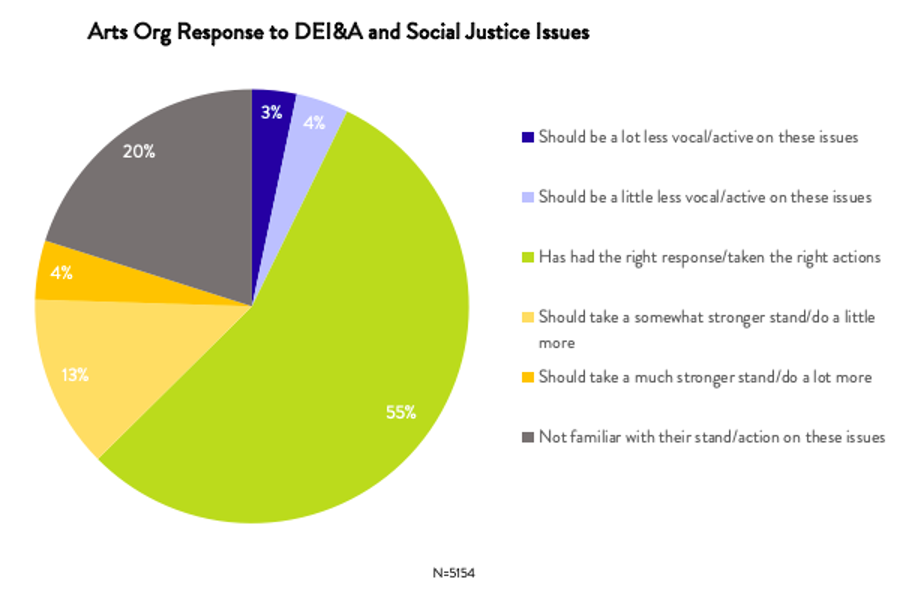
As shown in the above chart, just a combined 7% of donors felt that their organizations should be less active and vocal. In fact, a majority were in agreement with the institution’s approach to issues of diversity and inclusion. Also notable is the 20% of donors who are just not engaged with the issue at all. These trends tended to stay relatively stable across regions and genres.
We hope that this provides a little relief that there is not a big portion of donors wishing arts organizations would stop their efforts. Those who disagree may be loud, but there are very few of them.
Timeline for Additional Data Analysis
Our work analyzing the data from our extensive survey is far from over. We will be providing an overall report of the findings, as well as more specific reports for different regions and genres. Additionally, each participating arts organization that had 100 or more survey participants will receive a custom report of their donors’ responses.

To access all of our case studies, recaps, and other articles, visit our Donor Summit homepage here.
Watch the Recording Here
